Nifty 50 index, the headline stock market index in India and a preferred gauge of India's economic performance, often follows a unique path linked to economic growth, corporate earnings and investor sentiments. Over the last few decades, cues from the global markets have been dominant in shaping up the price action in local markets. One of the most critical global factors to impact the market sentiments is crude oil prices. This widely tracked and tremendously useful commodity plays a role in influencing its movements –on the down and on the up too. Crude oil is vital for powering the nation's industries and also serves as a factor contributing to volatility, leading the Nifty through a dynamic yet unpredictable journey. The linkeges between oil prices and the headline Nifty have undertone considerable changes in last decade or so and a staggering surge in oil prices does not really act as a deterring factor for the NIFTY50. Here is how the narrative has played out over the years and what it reflects for the current investors as they strive to make sense of the oil price volatility and what it means for the local indices!
The link between Nifty 50 Index and Global Crude Oil Prices:
Crude oil prices have a significant impact on the economic activity given that the commodity impacts value chains across industries and plays a key role in pushing up the aggregate costs. A surge in crude prices can elevate costs for transportation and manufacturing, impacting corporate profits and leading to a potential decline in the Nifty 50, especially for energy and transportation-dependent companies.
As India is a net importer of crude oil, increased prices can widen the current account deficit, prompting investors to adjust portfolios and affecting the Nifty 50. Exchange rate fluctuations due to higher crude prices also influence foreign institutional investment and impact the Nifty 50 index. From a broad perspective, central banks adjusting interest rates in response to inflationary pressures from crude prices can further influence investor behavior. Additionally, sectoral variances within the Nifty 50 arise as different sectors respond differently to changes in crude prices. Lastly, global economic uncertainty signaled by crude oil fluctuations impacts investor sentiment worldwide and, subsequently, the Nifty 50.
To sum it all up, it could be construed that soaring crude prices would mostly be termed as an adverse factor for the Nifty 50 index and a drop in crude prices is generally held to be good for local benchmark equity index. But is this relationship really that simple and that straightforward?
The following graph shows the trajectory of the Nifty 50 index and the global crude oil prices over last two decades.
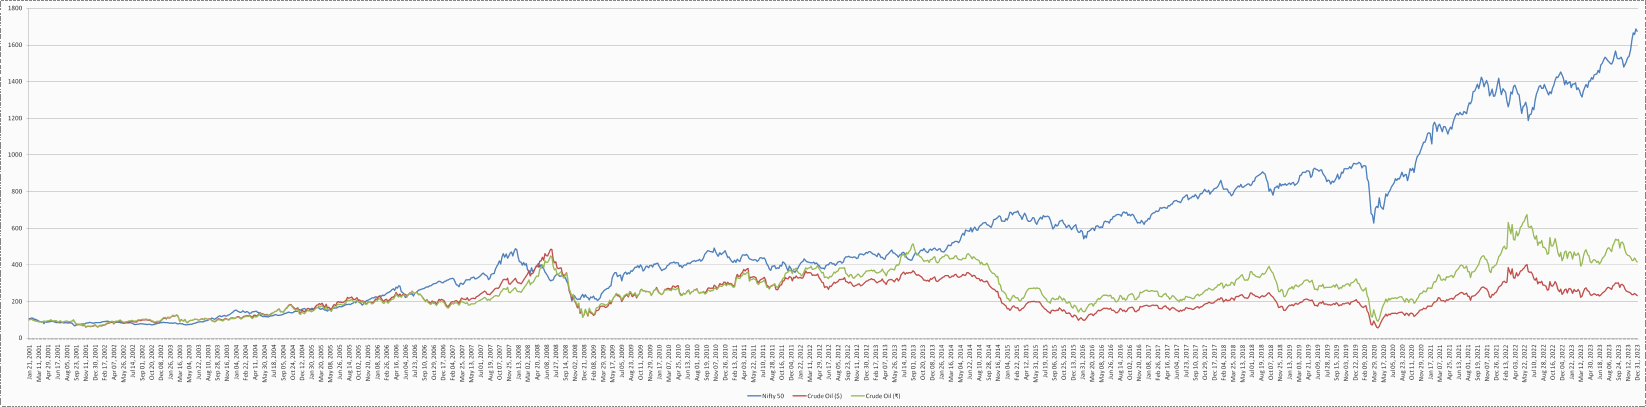
A brief examination of the graph shows that the benchmark Nifty 50 index has had explosive growth over the years while the price of crude oil has stayed somewhat in the 200 to 400 level over the year. There are some periods where a rise in crude oil price has led to a decline in the Nifty 50 index while in other periods, the reaction from the benchmark equity index has been quite the opposite. A similar kind of behavioral pattern is also visible in the case where crude price witness a downfall.
This warrants a closer examination.
Figure 1 Crude price spikes and consequent sell-offs in Nifty 50
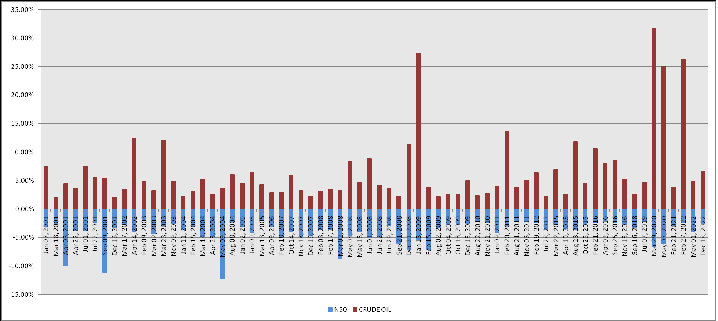
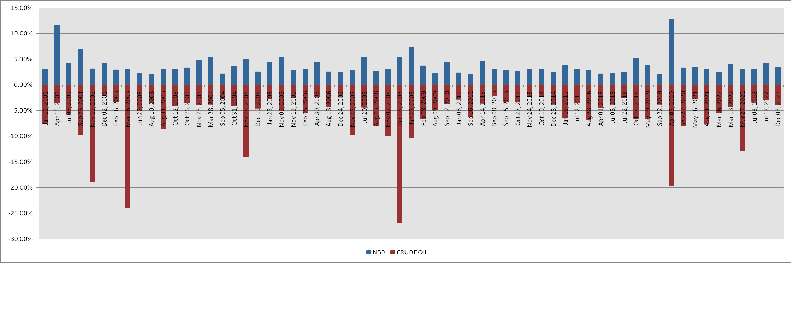
Figure 2 When falling Crude fuels the Nifty 50 rally
Analysing the data of Nifty 50 index and crude oil price movements for the past two decades, we could summarize two things quite clearly:
- While sharp spikes in crude oil prices used to traditionally send shivers down the Nifty 50's spine, recent surges have elicited a less pronounced reaction.
- The working of this relationship when crude prices are on a downward trajectory, however, appears a bit more complex. While some instances show small drops in crude oil prices fueling sharp rallies in the Nifty 50, other instances reveal certain scenarios wherein steep oil declines fail to ignite significant gains in the benchmark equity index.
One hypothesis explains this disparity on the downside: the impact of a crude oil price drop on the Nifty 50 hinges heavily on the price level and trend of the oil itself. Whenever crude oil prices have remained elevated above certain threshold levels, even minor dips would trigger a strong positive response in the Nifty 50. This reflects relief from perceived pressure on inflation and import bills.
Conversely, during periods of a sustained downtrend in crude oil prices, further drops in crude fail to stimulate a significant rise in the domestic equity market. This could be due to the fact that the boost to consumer spending and corporate profits from cheaper oil already would have been factored into stock prices over time during periods of sustained downtrend in crude oil.
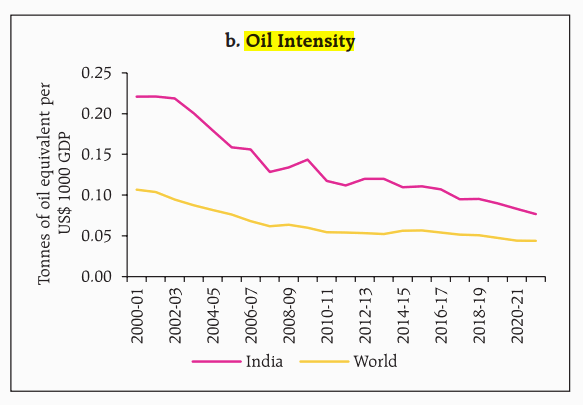
With respect to the softening reaction of the Nifty 50 index to sudden crude price spikes, one explanation for this phenomenon could be the fact that oil intensity of India’s GDP, i.e., the volume of oil consumed per unit of GDP, has been on the decline.
Figure 3 India's Crude Oil Intensity
Analysing the data of Nifty 50 index and crude oil price movements for the past two decades, we could summarize two things quite clearly:
- While sharp spikes in crude oil prices used to traditionally send shivers down the Nifty 50's spine, recent surges have elicited a less pronounced reaction.
- The working of this relationship when crude prices are on a downward trajectory, however, appears a bit more complex. While some instances show small drops in crude oil prices fueling sharp rallies in the Nifty 50, other instances reveal certain scenarios wherein steep oil declines fail to ignite significant gains in the benchmark equity index.
One hypothesis explains this disparity on the downside: the impact of a crude oil price drop on the Nifty 50 hinges heavily on the price level and trend of the oil itself. Whenever crude oil prices have remained elevated above certain threshold levels, even minor dips would trigger a strong positive response in the Nifty 50. This reflects relief from perceived pressure on inflation and import bills.
Conversely, during periods of a sustained downtrend in crude oil prices, further drops in crude fail to stimulate a significant rise in the domestic equity market. This could be due to the fact that the boost to consumer spending and corporate profits from cheaper oil already would have been factored into stock prices over time during periods of sustained downtrend in crude oil.
With respect to the softening reaction of the Nifty 50 index to sudden crude price spikes, one explanation for this phenomenon could be the fact that oil intensity of India’s GDP, i.e., the volume of oil consumed per unit of GDP, has been on the decline.
Figure 3 India's Crude Oil Intensity
Source: Financial Stability Report, Reserve Bank of India (December 2023)
In its latest Financial Stability Report, the Reserve Bank of India states that an oil price surge of 10 per cent from the baseline of US$ 85 per barrel could weaken domestic growth by 15 basis points and increase inflation by 30 basis points. The declining oil intensity of GDP could, however, offset the impact of the oil price shock.
In common parlance, this would mean that the economy now needs less oil per unit of output compared to the past. This efficiency translates to a smaller impact of oil price surges on overall growth and inflation. Therefore, while an oil shock remains a risk, its sting might be lessened thanks to India's more-services driven nature of economy.
Changes in the Sectoral Composition of the Nifty 50 Index over time:
While analyzing the Nifty 50's response to global oil price volatility, one often overlooked factor is the declining weight of the Oil & Gas sector within the benchmark index. This crucial aspect, often sidelined in discussions, holds the key to understanding the impact of crude movements on Indian equities.
Table 1 Sectoral composition of Nifty 50 Index across years [figures are in percentage terms]
| SECTOR |
1995 |
2005 |
2015 |
2021 |
2023 |
| Financial Services |
20 |
12.8 |
31 |
37 |
35.3 |
| IT |
- |
20 |
16.3 |
17.9 |
13.6 |
| Oil & Gas |
9.8 |
25 |
9.1 |
11.9 |
11.4 |
| Consumer Goods |
19 |
8 |
10.1 |
10.8 |
9.2 |
| Automobile |
12.2 |
6.8 |
9.9 |
5.1 |
6.5 |
| Metals |
10.9 |
5.5 |
2.8 |
3.4 |
3.8 |
| Pharma |
2.7 |
4.2 |
7.3 |
3.3 |
4.0 |
| Construction |
4.5 |
1.8 |
3.7 |
3 |
4.4 |
| Cement & Cement Products |
5.5 |
2.5 |
2.8 |
2.5 |
2.1 |
| Telecom |
- |
6.3 |
2.2 |
2.2 |
2.8 |
| Power |
2 |
1.5 |
2.6 |
1.8 |
2.7 |
| Services |
1.1 |
1.1 |
0.8 |
0.7 |
0.8 |
| Fertilisers & Pesticides |
1.9 |
- |
- |
0.5 |
- |
| Textiles |
2.2 |
- |
- |
- |
- |
| Chemicals |
5.8 |
0.8 |
- |
- |
0.3 |
| Consumer Services |
1.9 |
- |
- |
- |
- |
| Media, Entertainment & Publication |
- |
0.5 |
0.8 |
- |
- |
| Industrial Manufacturing |
0.6 |
3.1 |
0.5 |
- |
- |
| Consumer Durables |
- |
- |
- |
- |
3.2 |
Source: Nifty50 Journey of 25 Years (1995 - 2021) and NSE Indexogram for the Nifty 50 index.
From the above table, it is evident that, over the years, the Oil & Gas sector's share in the Nifty 50 has shrunk significantly. This means crude price swings primarily affect a smaller pool of companies now, unlike in the past. At its peak, the index held 25% weight in the Nifty 50 index in the year 2005. This has fallen to 11.4% at the end of 2023. Of this, if one excludes Reliance Industries (which has a weight of 9.2% in Nifty 50 index), the weight of pure play oil & gas stocks viz., ONGC and BPCL is 0.84% and 0.45%, respectively. Their minimal presence underscores the diminishing influence of this sector on the benchmark Nifty 50 index.
However, it's not just the declining presence that matters. The companies operating in this sector and those that are reliance on crude as a primarily input for their operation (e.g. aviation, paints, etc.) have also become more resilient to volatility. They have adopted effective hedging strategies and strong business practices, thereby minimizing the direct impact of oil price fluctuations on their earnings.
The Rise of Services Sector
Another less talked about aspect when it comes to ways in which India has manage to shock-proof itself from sudden spikes in oil prices, is the rise and role of the Services Sector in the domestic economy.
Over the last two decades, India's Gross Domestic Product (GDP) experienced a tenfold increase, while the volume of its crude oil imports witnessed a comparatively modest growth of 5.5 times. This pronounced decoupling, with GDP expanding at twice the rate of oil imports, signifies a fundamental shift in the structure of the Indian economy.
The primary catalyst for this decoupling rests squarely upon the burgeoning service sector, a comparatively energy-frugal engine of economic growth. As of the year 2022, the service sector constituted a substantial 48.4% of India's GDP, thereby underscoring its pivotal role in propelling the nation's economic ascent while minimizing dependence on fossil fuels.
Figure 4 Services Value Added (Percentage of GDP) - India
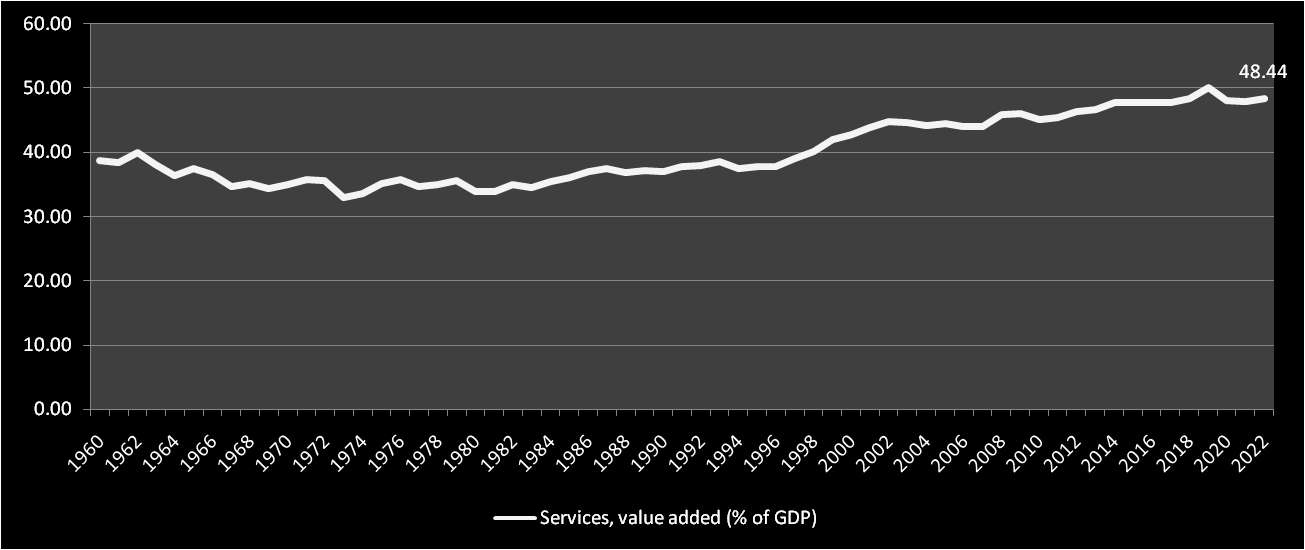
Source: World Bank
On the contrary, the energy-intensive manufacturing sector, while crucial for long-term economic development, accounted for only 13% of India's GDP in 2022.
Figure 5 Manufacturing Value Added (Percentage of GDP) - India
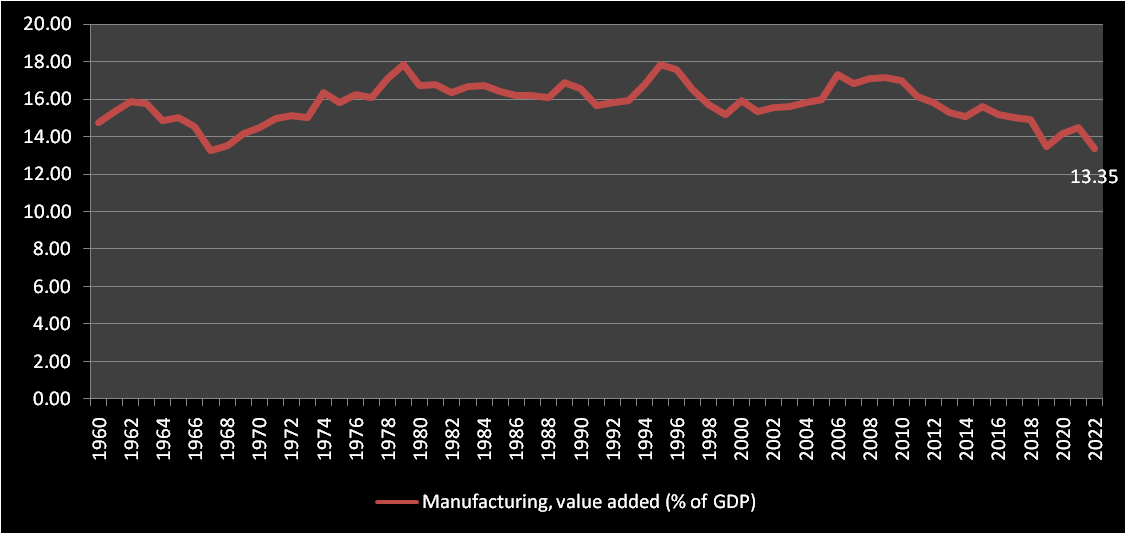
Source: World Bank
As global oil prices surge, India's robust service sector emerges as a significant bulwark against economic volatility. Unlike its oil-dependent counterparts, India's economic engine hums on the back of knowledge-intensive industries like IT, healthcare, and tourism, generating a substantial gross value added (GVA) from services. This diversification serves as a crucial shock absorber, mitigating the deleterious effects of oil price fluctuations on various fronts.
Firstly, the diminished dependence on imported oil inherent in the service sector shields the trade balance from drastic deterioration. The oil shock's impact on the current account balance is correspondingly moderated, as the foreign exchange outflow necessitated by increased oil imports is partially offset by the service sector's inherent ability to generate foreign currency through exports and tourism.
Secondly, the fiscal resilience of the government is bolstered by the service sector's contribution to the exchequer. The sector’s revenue streams, remaining relatively unscathed by oil price shocks, help the government to maintain a certain degree of stability in its tax revenues and in turn, offer stability to the crucial public spending amidst economic turbulence.
Furthermore, the service sector's dynamism in generating foreign exchange serves as a vital counterweight to the increased outflows due to oil imports. This foreign currency influx serves as a buffer against external shocks, bolstering India's foreign exchange reserves and enhancing the nation's overall economic stability.
Financialization of Crude Oil
In recent times, commodity futures have become a popular asset class for portfolio investors, just like stocks and bonds. This process is sometimes referred to as the financialization of commodity markets. The reason for the popularity of these future contracts primarily lays in the fact that commodity prices are believed to move in a direction opposite to that of equity prices. Hence, exposure to commodities is considered a natural hedge against equity price risks. In the post-GFC world, however, the financialization of commodities gathered significant steam as developed economies grappled with low interest rates and investors sought higher returns in riskier assets like crude oil along with EM equities.
Global commodity prices slumped in the aftermath of the global financial crisis in 2008 but recovered swiftly. While the strong increase in commodity prices had been driven by global economic growthpropelled by emerging economies, speculative investment flows into commodity markets amplified the intensity of the price surge. This also marked the era when dynamics of global commodity prices started changing, in accordance with the growing presence of financial investors in commodity markets and paved the way for the "financialization of commodities". Consequently, global commodity markets have become more sensitive to portfolio rebalancing by financial investors, which has made commodity markets more correlated with other asset markets, including major equity markets. Globally accommodative monetary conditions have played an important role in the surge in commodity prices, both by stimulating physical demand for commodities and driving more investment flows into financialized commodity markets.
FII and DII Inflows into the Domestic Benchmark Nifty 50 Index:
Following the Global Financial Crisis, emerging market economies continued to grow in economic terms, driven by globalization and increased foreign investment. Investors, seeking better returns than those offered by recovering developed markets, directed their capital towards these nation states. India, with its potential for growth and need for capital, attracted a considerable share of this investment.
The influx of foreign capital, facilitated by Foreign Institutional Investors (FIIs), significantly influenced the Indian stock market. There have been studies that have highlighted the impact of FII flows on market indices until 2014, shaping the market's trajectory.
However, a shift occurred after 2014. Domestic Institutional Investors (DIIs), backed by growing retail investor participation through mutual funds, began contributing substantial capital to the market, challenging the once-dominant role of FIIs.
According to latest data from Association of Mutual Funds in India (AMFI), the systematic investment plans (SIP) of Indian mutual funds gathered Rs 13,573.08 crore from investors, up from Rs 13,306.49 crore invested in November 2022. Last month's SIP contribution was much higher than Rs 11,305.34 crore that was invested in December 2021.
Despite ongoing market volatility, Systematic Investment Plans (SIPs) have remained remarkably resilient. In the first 9 months of FY24 (April-December 2023), SIP inflows reached Rs 1.41 lakh crore, a mere 9% decline compared to the full year total of Rs 1.55 lakh crore in FY23. This is even higher than the Rs 1.24 lakh crore recorded in FY22.
This consistent and significant inflow of funds from domestic investors provides a crucial buffer against market downturns triggered by foreign institutional investor (FII) outflows or rising crude oil prices. The ample ammunition at the disposal of domestic institutions allows them to absorb volatility and stabilize the market.
Conclusion:
The relationship between crude oil prices and NIFTY50 has undergone a definitive change in last decade with the post GFC dynamics twisting the conventional norms for asset prices. The Covid-19 pandemic probably reflected this new reality in a wholesome manner when crude oil prices led the tumble in risky assets and turned negative in April 2020. Oil tanked in tandem with equities and went up in tune with them in second half of 2020. For local markets, the emergence of domestic investors as a might power and sustained declined in crude oil dependency would mean that the current decade will continue to see relationship between crude oil prices and NIFTY50 to evolve in line with the dynamics of the last one decade. This means that unless an extremely sharp spike takes place in crude oil, local headline index may be able to cope up with oil prices gains in a resilient manner. The marked shift in economic structure towards services and sustained focus on boosting renewable energy will also ensure that oil becomes just another source of volatility for local indices than being a critical one.